Agile estimation: the complete guide
A practical guide to agile estimation: user stories, planning poker, story points, velocity, and the techniques that hold up when a story turns out bigger than it looked.
Estimation goes wrong in familiar ways: numbers that mean different things to different people, sessions that overrun, forecasts nobody trusts. The fix is rarely a better formula. It’s a shared understanding the whole team owns, and estimates kept as forecasts rather than commitments held against you.
This guide works through the parts that hold up in practice: user stories, planning poker, story points, velocity, and the techniques that keep working when a story turns out bigger than it first looked. When you’re ready to run estimation with your team, estimate in TeamRetro: planning poker with private voting, reusable decks, and final story points that sync straight to your backlog.
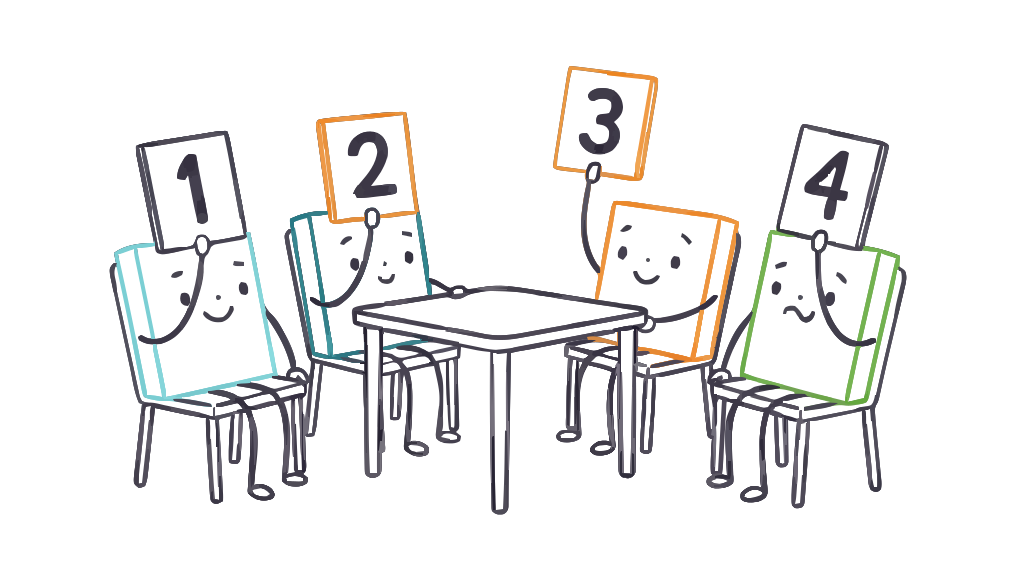
Planning poker is a consensus-based agile estimation technique: teams vote privately, reveal every card at once, and discuss the spread until the estimates converge.
How to run a planning poker session that gives useful estimates without dragging: prep, the four-phase round, choosing a deck, and ruthless time-boxing.

Story point estimation sizes the relative effort, complexity and uncertainty of work, not the hours. How to size against a reference story, and the questions that trip teams up.

Story points climb 1, 2, 3, 5, 8, 13 because the widening gaps encode uncertainty: the scale stops pretending you can tell a 13 from a 14. Here's why the gaps are the point.

Story points measure relative effort; hours measure duration. They are different axes. Build a points-to-hours table and you've quietly gone back to estimating time.
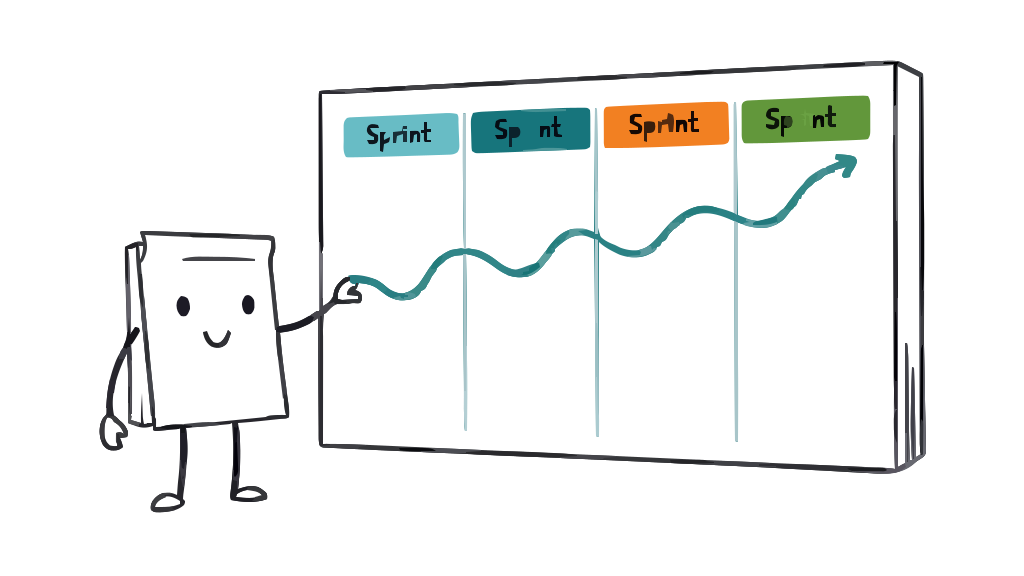
Learn what team velocity is in agile, how to calculate it, and how to plan sprints with it, plus a free velocity calculator.
People are bad at 'how long will this take' and good at 'is this bigger than that.' Relative estimation uses the second, and it's why story points work.
Early estimates are wide because the work is unknown, not because your team is bad at estimating. What the cone of uncertainty means, and how to narrow it, not pad it.

Epics, stories and tasks are three tiers with three jobs. What each is, which one carries story points, and why pointing the wrong tier makes velocity meaningless.

A practical decision guide to agile estimation techniques: planning poker, story points, t-shirt sizing, affinity estimation and velocity, and which to use when.
The recurring ways planning poker sessions go wrong (averaging cards, estimating in hours, weaponized velocity, story-point inflation) and how to fix each.
Acceptance criteria are a story's pass/fail test, written before work starts: the formats that work, worked examples, and how they differ from the definition of done.
The definition of done (DoD) is one checklist every story clears before it ships. Example checklists, how to write yours, and DoD vs acceptance criteria.

The definition of ready is the checklist that says a story is sprintable. What a useful one covers, why most get ignored, and the version that actually blocks.
A story you can't estimate is usually one you can't ship yet. How to tell when to split, the cut lines that produce shippable slices, and the ones that only fake it.
SPIDR is five reliable ways to split a user story: spike, path, interface, data, rules. Each cut line, when it works, and when it produces a fake slice.
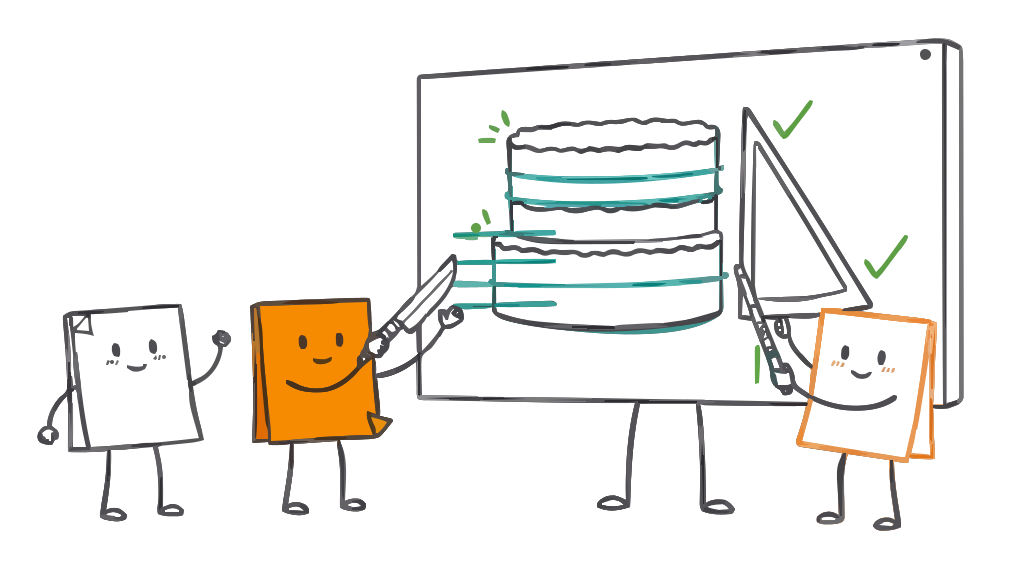
Vertical slices ship value; horizontal slices ship promises. Why splitting by tech layer defers value, and how to slice by user outcome so something ships each sprint.
A user story is a short, plain-language promise of value. The role-goal-benefit format, the three Cs, the INVEST checklist, and the cases where stories are the wrong tool.
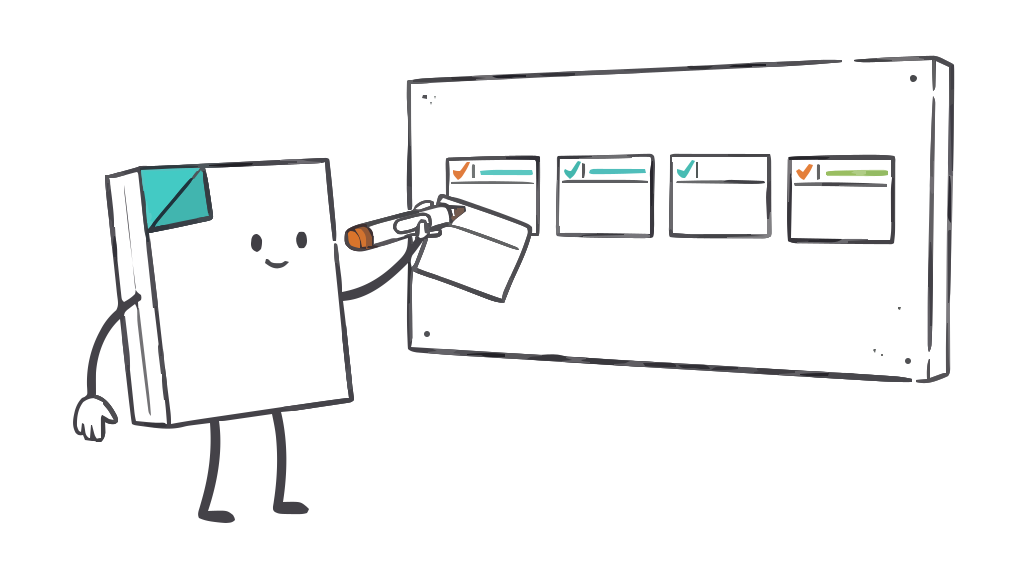
Sixteen annotated user story examples across auth, e-commerce, mobile, APIs and bugs, with the bad versions shown next to their rewrites so the difference is visible.
The classic user story template with a copy-paste card, the variants worth knowing, and one worked example carried from template to acceptance criteria to estimate.
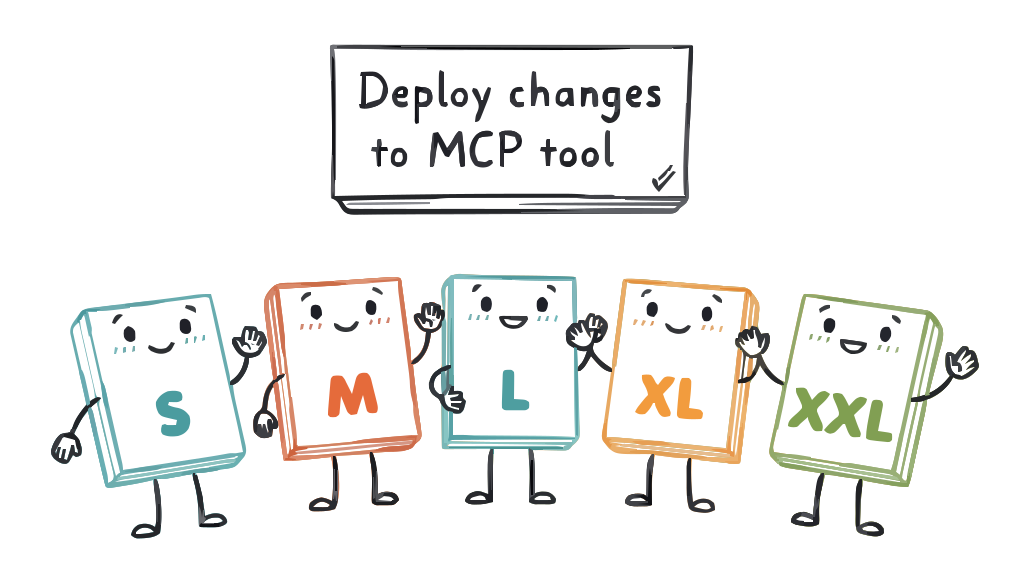
What t-shirt sizing is, how to run a session, and how to turn S/M/L into story points, plus when planning poker is the better call.
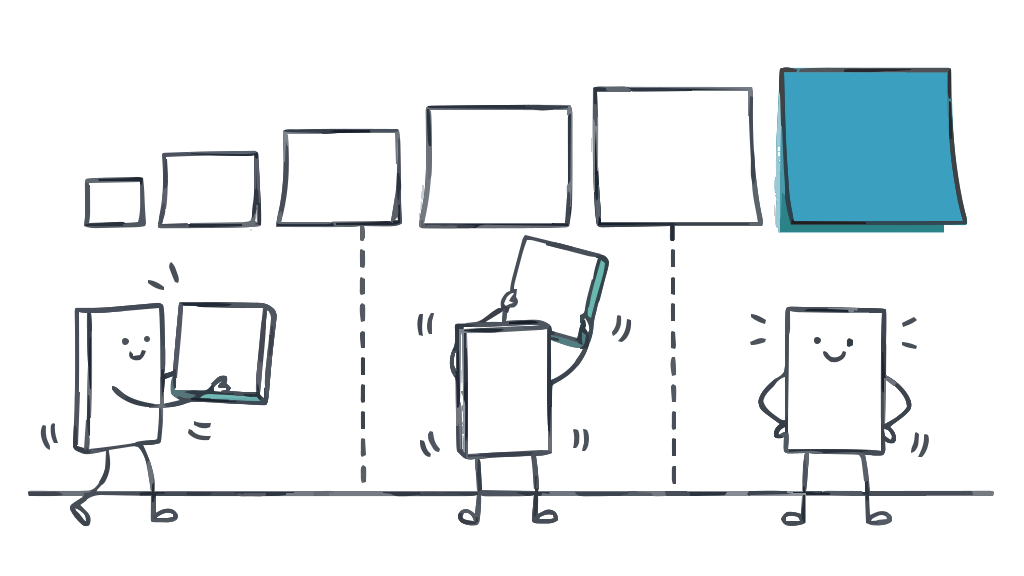
How affinity estimation sizes a whole backlog in one session: the silent-sort steps, when it beats planning poker, and how to turn it into story points.