Agile and engineering metrics: what to measure, and what to do with it
No single number measures a team. Agile metrics work as a set of delivery, flow and perception measures, read together to start conversations, not rank people.
There is no single number that tells you how productive a team is. Agile metrics work as a set: delivery measures for how fast and how safely changes ship, flow measures for how work moves, and perception measures, from surveys and health checks, for how the work feels to the people doing it. Read them together, use them to start a conversation with the team, and never use them to rank people.
This guide covers the metrics engineering and agile teams actually use: DORA’s delivery measures, the SPACE and DevEx frameworks, DX Core 4, flow and scrum metrics, health checks and maturity models, and what to do once you have the numbers. This page puts them side by side and helps you pick a starting point. Each chapter goes deep on one.
The frameworks side by side
A common source of confusion about agile and engineering metrics is treating different kinds of framework as rival lists. Some are fixed sets of metrics, such as DORA’s five or the Kanban Guide’s four flow measures. SPACE is a framework for choosing metrics. DevEx and health checks start from how people experience the work. They answer different questions, so a team that uses more than one is usually doing it right.
| Framework | What it measures | Data source | Level | Origin |
|---|---|---|---|---|
| DORA metrics | Software delivery throughput and instability, in five metrics | System (pipeline and incident records); DORA’s own research uses a survey | One application or service | DORA (DevOps Research and Assessment), first study 2014; five metrics since the 2024 report |
| SPACE | Developer productivity across five dimensions; a framework for choosing metrics, not a set of them | Both, by design | Individual, team or group, and system; results reported at team or group level | Forsgren, Storey, Maddila, Zimmermann, Houck and Butler, ACM Queue 19(1), 2021 |
| DevEx | Developer experience: feedback loops, cognitive load and flow state | Both: perceptual and workflow measures | Team and organization | Noda, Storey, Forsgren and Greiler, ACM Queue 21(2), 2023 |
| DX Core 4 | Speed, Effectiveness, Quality and Impact, with one key metric each | Both; DX recommends starting from self-reported baselines | Team and organization | DX, announced December 2024 |
| Flow metrics | How work moves: WIP, throughput, work item age and cycle time | System (the team’s board or work tracker) | A team’s workflow | The Kanban Guide (John Coleman and Daniel Vacanti, May 2025 edition); Little’s Law (John Little, 1961) |
| Scrum metrics | Sprint outcomes and planning calibration: sprint goal success, carry-over, escaped defects, burnup | Sprint records, plus a yes or no at the sprint review | One scrum team | Practitioner conventions; the 2020 Scrum Guide prescribes no metrics |
| Health checks | How the work feels to the team right now | Survey | Team | Well-known public model: the Spotify Squad Health Check (Henrik Kniberg and Kristian Lindwall, 2014) |
| Maturity models | How developed a team’s practices are, against written levels | Team self-assessment | A team’s practices | CMMI-style level schemes; the Continuous Delivery Maturity Model (Rehn, Palmborg and Boström, InfoQ, 2013) |
The lineage runs through most of the table. Nicole Forsgren co-authored Accelerate, led DORA, and co-wrote the SPACE and DevEx papers, and DX Core 4 describes itself as a framework that “encapsulates DORA, SPACE, and DevEx.” The SPACE chapter shows how DORA’s metrics slot into a SPACE set, and the developer experience chapter covers the 2023 productivity debate and where DevEx and DX Core 4 fit in it.
Which metric answers which question
Start from the question you need answered, not from the dashboard you already have. A metric chosen because a tool happens to report it rarely changes a decision.
- Is delivery getting faster, and is it breaking more? Start with the five DORA metrics, read for one service over time.
- Is work slow or stuck even though everyone is busy? The flow measures in lead time vs cycle time separate time spent waiting from time spent working.
- Do your sprints deliver what they set out to? Scrum metrics covers sprint goal success, carry-over and escaped defects, and the burndown chart chapter covers reading progress within a sprint.
- Have you been asked to measure developer productivity? Use SPACE to choose a balanced set, and developer experience metrics to find what slows developers down.
- Do the numbers look fine while the team doesn’t? Health checks and maturity models cover the perception data no pipeline records.
What the numbers can’t tell you
Metrics show what is happening. The why usually comes from the people doing the work. A cycle-time chart can show that work now sits twice as long before release; only the team knows whether that is a new approval step, a reviewer who is also on call, or a dependency on another team.
That knowledge surfaces in a retrospective, a health check or a one-to-one, not in a dashboard. TeamRetro’s retrospectives and health checks are tools for finding the why. Whatever you use, from numbers to actions covers the loop from a number to a cause to a change, and back to the number.
Five principles that hold across every framework
- Measure teams, not individuals. Delivery metrics describe a team’s system. DORA puts it directly: “Software delivery performance is not an individual measure.” The SPACE paper advises reporting only anonymized, aggregate results at team or group level. A per-person leaderboard ranks people on parts of the system they don’t control.
- Pair speed with stability. Every speed measure needs a counterweight. DORA advises metrics with “a healthy amount of tension between them,” and its research finds that speed and stability are not a trade-off: top performers do well across all five. Read deployment frequency next to change fail rate, and cycle time next to escaped defects.
- Expect Goodhart’s law. In Marilyn Strathern’s 1997 wording, “When a measure becomes a target, it ceases to be a good measure.” Mandate a deploy count and releases get split; grade velocity and points inflate, which is the case the velocity verdict makes. The from numbers to actions chapter covers the other ways metrics decay.
- Trends over targets. Compare a team with its own past, not with another team or an industry table. DORA’s performance levels come from a fresh cluster analysis of each year’s survey, so the thresholds and even the number of groups change, and DORA itself says the best teams are those that achieve “elite improvement, not necessarily elite performance.” Six to twelve periods of a trend tell you more than any single reading.
- Perception data is data. Trust, morale and whether people raise bad news leave no log. DORA measures culture by survey because culture “is a perceptual measure,” and the SPACE paper asks for at least one perceptual measure in every set. Ask the same questions on a steady cadence and treat the answers as evidence. The team health check guide covers running one, and psychological safety decides how candid the answers are.
For published research figures on agile adoption, retrospectives and team health, each tied to its primary source, see agile statistics.
Frequently asked questions
What are agile metrics?
Agile metrics are measures a team uses to see how its work is going: how fast and how safely it delivers, how work flows, whether sprints meet their goals, and how the work feels to the people doing it. They range from system data, such as DORA’s delivery metrics and Kanban flow measures, to perception data from surveys and health checks. No single one tells the whole story, so teams read a few together.
Which agile metrics matter most?
The ones that answer the question your team is asking. As a starting set, pick one speed measure (such as change lead time or cycle time), one stability or quality measure (such as change fail rate or escaped defects), one flow measure (such as work item age) and one perception measure (such as a quarterly health check). DX Core 4 uses a similar shape: one speed, one experience, one quality and one impact measure, read together.
What is the difference between agile metrics and KPIs?
A metric is anything you measure. A KPI, or key performance indicator, is a metric chosen to show progress toward a specific result, usually with a target attached. Most agile metrics work better as diagnostics than as KPIs, because once a number like velocity or deployment frequency carries a target, teams start optimizing the number instead of the work. If leadership needs KPIs, choose outcome measures, read them as trends, and keep the team’s calibration metrics, such as velocity, out of them.
How many metrics should a team track?
A handful. The SPACE paper recommends metrics from at least three of its five dimensions, at least one of them perceptual, and warns that too many metrics may lead to confusion and lower motivation. In practice, three to five metrics that fit on one screen, tracked as trends, are enough to show the trade-offs without turning the review into a dashboard tour.

DORA metrics are five measures of software delivery: change lead time, deployment frequency, recovery time, change fail rate and deployment rework rate.

SPACE is a framework for choosing developer productivity metrics across five dimensions, not a set of five metrics. What each means, and DORA vs SPACE.

No single number measures developer productivity. Pair team outcomes with developer experience metrics for feedback loops, cognitive load and flow state.

Lead time runs from request to delivery; cycle time from start to finish. Exact start and end points, DORA's take, throughput, WIP, item age and Little's Law.

Sprint goal success, carry-over, escaped defects, burnup and the say/do ratio: what each scrum metric is for, who should see it, and how it gets gamed.
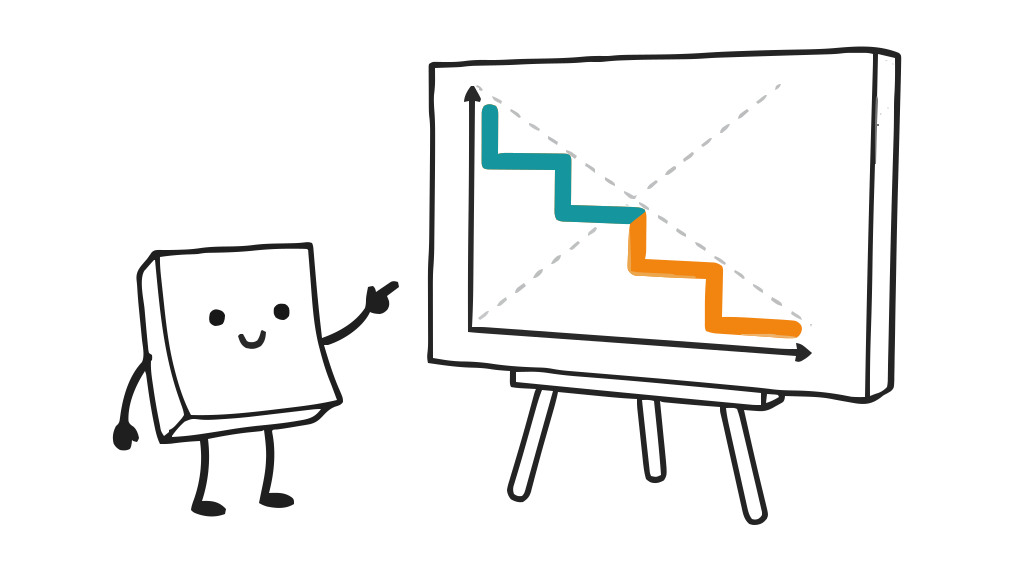
Een burndown-grafiek geeft de resterende werkhoeveelheid weer in relatie tot de tijd. Leer hoe u de lijn tussen de ideale en de werkelijke stand kunt interpreteren, wat het verschil is met een burnup-grafiek en wat deze informatie over een sprint onthult.

A DevOps maturity model rates your practices against levels; a health check asks how the work feels now. What each measures, the public models, how to use them.

Metrics show what changed, not why, and they decay once they become targets. The limits of DORA metrics, Goodhart's law, and a loop that turns numbers into action.