Lead time vs cycle time: flow metrics explained
Lead time runs from request to delivery; cycle time from start to finish. Exact start and end points, DORA's take, throughput, WIP, item age and Little's Law.
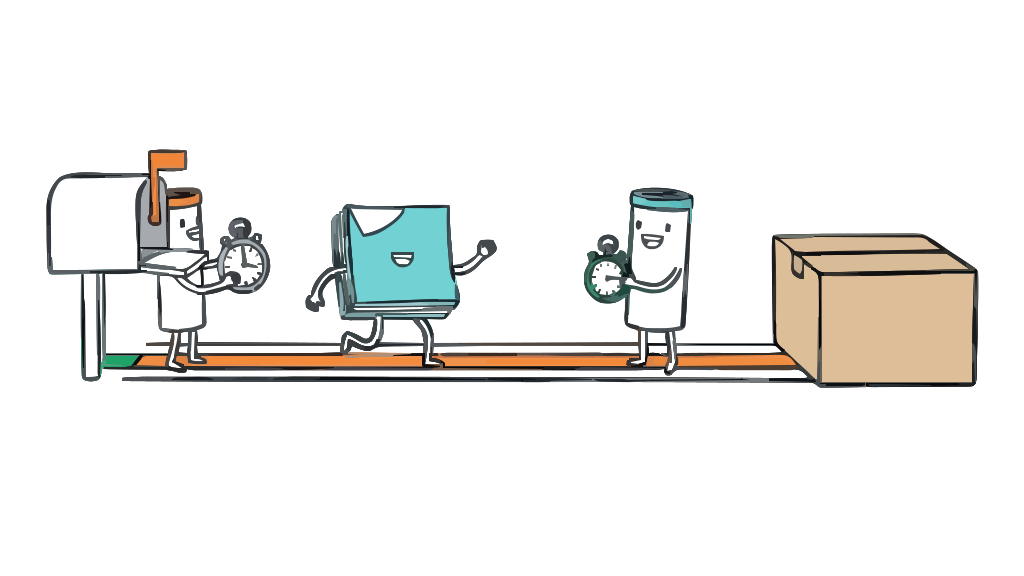
Lead time runs from the moment someone asks for a piece of work to the moment it’s delivered. Cycle time runs from the moment the team starts that work to the moment it’s finished. Lead time is the customer’s wait; cycle time is the part of that wait the team controls. This page uses those Kanban definitions. DORA’s “change lead time” is a third, narrower clock that starts at the commit, and it is covered below so you can tell them apart.
Both are flow metrics: measures of how work moves through a system, not how much effort it took. The reference for cycle time and the other flow measures is the Kanban Guide by John Coleman and Daniel Vacanti (May 2025 edition); the lead time definition comes from Kanban University. This chapter of the agile metrics guide covers the clocks, the four measures the guide makes mandatory, flow efficiency, and Little’s Law.
Where each clock starts and stops
- Lead time starts when the request is received and stops when it is delivered. Kanban University defines customer lead time as “the time between receiving the customer’s request and delivering on it”. Backlog wait counts.
- Cycle time starts when the team starts the item and stops when it is finished. The Kanban Guide: “The elapsed time between when a work item started and when a work item finished.”
- Change lead time (DORA) starts when a change is committed to version control and stops when it is deployed in production, per dora.dev.
Lead time always contains cycle time. The gap between them is the queue: how long work sits after it is asked for and before anyone picks it up. A team can cut cycle time in half and leave the customer’s wait almost unchanged if most of the lead time is backlog.
| Clock | Starts | Stops | Answers | Defined by |
|---|---|---|---|---|
| Lead time | Request received | Delivered to the customer | How long does the customer wait? | Kanban University (customer lead time) |
| Cycle time | Team starts the item | Item meets the team’s “finished” point | How long does our process take, once started? | Kanban Guide |
| Change lead time | Commit to version control | Deployed in production | How fast is our delivery pipeline? | DORA |
| Cycle time (manufacturing) | One unit or process step begins | That unit or step completes | How long does one part take to make? | Lean Enterprise Institute |
Why the definitions don’t agree
When two articles give different start points, each is usually quoting a real source. Four things cause the disagreement.
The Kanban Guide doesn’t define lead time at all. It names four measures and leaves the start and finish points to the team: a Kanban system needs “a definition for when work items are started and finished,” and a workflow “may have more than one started or finished point.” So two Kanban teams’ cycle times are rarely comparable.
Kanban University changed its own definition. It used to measure customer lead time from the commitment point, when the team accepts the request. In April 2023 it moved the start to the moment the request is received, because the older definition was “creating confusion due to other established definitions of customer lead time.” Its separate “system lead time” still starts at the commitment point.
DORA measures a different stretch. DORA’s metric covers commit to production only. It called this “lead time for changes” in its 2014 study, and its current five-metric model calls it “change lead time” (DORA’s metric history). It leaves out discovery, design and backlog wait, so it isolates the delivery pipeline. A team can have a change lead time of hours and a customer lead time of months. The DORA metrics chapter covers it alongside DORA’s other measures.
Manufacturing uses the same words differently. The Lean Enterprise Institute defines cycle time as “the time required to produce a part or complete a process,” and production lead time as the time “to move all the way through a process or a value stream from start to finish.” Takt time, the third term in most manufacturing comparisons, is “the available production time divided by customer demand”: a target pace, not a measured duration.
TeamRetro’s Flow Metrics Self-Assessment for Teams asks whether the team shares those definitions, along with how it experiences WIP, stuck work and predictability.
The four flow measures
The Kanban Guide makes four measures mandatory and says teams “may and often should use additional context-specific measures.”
| Measure | Kanban Guide definition | Unit | Misleads when |
|---|---|---|---|
| Work in progress (WIP) | “The number of work items started but not finished” | Items | Items vary wildly in size, or blocked items are moved off the board |
| Throughput | ”The number of work items finished per unit of time” | Items per week | Items are split smaller to inflate the count |
| Work item age | ”The elapsed time between when a work item started and the current date” | Days | Nobody looks at it until the item finishes |
| Cycle time | ”The elapsed time between when a work item started and when a work item finished” | Days | It’s reported as one average instead of a distribution |
WIP is the measure you control directly. The Kanban Guide on limiting it: “An effect of controlling WIP is that it should create a pull system.” New work starts when something finishes, not when someone asks.
Throughput counts finished items, not points, which is why it is harder to inflate than velocity. Our velocity verdict argues that teams with uniform work can forecast from throughput and skip story points.
Work item age is the only one of the four that looks at unfinished work, which makes it the early warning. Cycle time tells you an item took 30 days after it has taken 30 days. Age tells you on day 12 that it is already older than most items ever get. Vacanti’s Actionable Agile Metrics for Predictability gives the work item aging chart two chapters.
Cycle time is a distribution, not a number. The Kanban Guide’s answer is the service level expectation (SLE), which has “two parts: a period of elapsed time and a probability associated with that period.” Its example: “85% of work items will be finished in eight days or less.” An SLE is built from your historical cycle times, so it is a forecast you can defend.
Flow efficiency
Flow efficiency is the share of lead time an item spends being worked on. Julia Wester’s Lean Kanban University article (2016) calculates it by “dividing the active work time by the overall lead time,” expressed as a percentage. An item that took 20 days end to end and was worked on for 4 of them is at 20%.
The same article says the most generous estimate Wester had seen puts teams that haven’t paid attention to it “around the 15% mark,” and quotes David J. Anderson that anything above 40% is good. At 15%, an item spends most of its life waiting, which is why cutting wait time usually beats speeding up the work.
Two cautions. Flow efficiency needs a board that separates waiting states (“ready for review”) from working states (“in review”); without them you’re estimating. And, as Wester notes, the result “will not tell you how to improve your efficiency.”
Mik Kersten’s Flow Framework, introduced in Project to Product (2018), is a separate model with its own named metrics and work item types. Check which model a dashboard uses before comparing its numbers with the Kanban measures here.
Little’s Law in plain words
John Little proved it in 1961. In his own 50th-anniversary paper (Operations Research, 2011): “the average number of items in a queuing system … equals the average arrival rate of items to the system … multiplied by the average waiting time of an item in the system.” For a team’s board, that becomes:
Average cycle time = average WIP ÷ average throughput
A worked example. Over the last quarter your team averaged 12 items in progress and finished 4 items a week. Average cycle time is 12 ÷ 4 = 3 weeks. Now hold throughput at 4 a week and cap WIP at 6: average cycle time drops to 1.5 weeks. Nobody worked faster. Each item simply spent less time queued behind the others.
That is the argument for WIP limits in one line of arithmetic: if throughput doesn’t change, starting more work only lengthens cycle time.
The assumptions. Little’s paper is clear that the law describes averages over a period you have already measured: “we are in the measurement business, not the forecasting business.” Teams also plug in throughput, the rate work leaves, where Little’s formula uses the rate work arrives, and that swap only holds when the period is stable. The conditions usually listed come from Vacanti’s work (his book’s appendix on the law has a section headed “It is all about the Assumptions”), as summarized in Planview’s documentation:
- Work arrives about as fast as it leaves.
- Work that is started eventually finishes, rather than being abandoned in place.
- WIP is roughly the same at the start and end of the period.
- The average age of WIP is neither rising nor falling.
- Cycle time, WIP and throughput use consistent units (all days, all items).
When these break, the formula still produces a number, but it stops describing your system. A team whose WIP climbed all quarter has already broken the first and third.
Reading flow metrics as a set
The useful readings come from combinations:
- WIP rising, throughput flat: the team is starting more than it finishes. Cycle time will rise next.
- Throughput steady, a few items very old: something specific is stuck. Look at age, not averages.
- Cycle time fine, lead time long: the delay is in the queue before work starts, which is a prioritization problem, not a delivery one.
- Flow efficiency low everywhere: handoffs and waiting states, not effort, are the constraint.
An aging chart can show that three items have been stuck in review for nine days; the people on the team know whether that is one overloaded reviewer, an unclear acceptance test, or a dependency on another team. That conversation belongs in the retrospective, and From numbers to actions covers how to bring the charts into the room. TeamRetro’s Kanban Flow Retrospective template structures that discussion around what flowed well, where the bottlenecks were, and whether WIP limits and policies are working.
Sprint teams can use all of these too. The scrum metrics chapter covers the sprint-shaped measures, such as carry-over, that sit alongside them.
Frequently asked questions
What is the difference between lead time and cycle time?
Lead time runs from the moment a request is received to the moment it is delivered, so it includes the time the item waits in the backlog. Cycle time runs from the moment the team starts the item to the moment it is finished. Lead time is what the customer experiences; cycle time is the part of it the team controls directly.
Is DORA’s lead time the same as Kanban lead time?
No. DORA’s change lead time runs from a change being committed to version control to that change being deployed in production. It leaves out the design work and the backlog wait that Kanban lead time includes, so it measures the delivery pipeline, not the customer’s whole wait.
What are the four flow metrics in Kanban?
The Kanban Guide names four mandatory flow measures: work in progress (items started but not finished), throughput (items finished per unit of time), work item age (time since an unfinished item started) and cycle time (time from start to finish).
How do you calculate flow efficiency?
Divide the time an item was actively worked on by its total lead time, then multiply by 100. An item that took 20 days end to end but was only worked on for 4 of them has a flow efficiency of 20%.
What does Little’s Law say about work in progress?
Little’s Law says that, in a stable system, average work in progress equals average throughput multiplied by average cycle time. Rearranged, average cycle time equals average WIP divided by average throughput. If throughput holds steady, carrying less work in progress shortens the average time each item takes. It describes averages over a period you have already measured; it is not a forecast for a single item.
Related reading
- Agile and engineering metrics: the hub, with every framework in this guide on one map.
- What are DORA metrics?: change lead time in context, next to deployment frequency and DORA’s stability measures.
- Scrum and sprint metrics: carry-over, sprint goal success and the other sprint-shaped measures.
- From numbers to actions: turning a flow chart into a cause and a change.
- Is velocity a useful metric?: why throughput is the harder number to game.