If you are anything like us, you value the happiness of the team of people you work with. Ensuring everyone can grow and feels supported is essential. Fostering a safe and fun environment is key to this. However, monitoring a team’s mood and safety levels can be a challenge.
We recently held our annual work retreat. Our core team members from four countries come together to reflect, plan and get to know each other better. Understanding the sentiment of individual team members was vital. It helped us plan sessions to address concerns and explore areas of interest and opportunity.
This post shares how we used the Team Health Check, the data we captured and what that data meant to us.
Using our health check as a mood meter
We love our team. They are the people who help build, deliver and improve TeamRetro.
A health check allows us to check in with them from time to time, and over time. It provides people the opportunity to share how they feel. It’s a quick survey that lets them easily indicate how happy they are across various health dimensions.
As a Scrum Master or leader, it gives us insight into areas of concern that we want to address as a team. As a team, the data points allow people to get a sense of how everyone else is and what they can do to support as needed.
We run our health checks every quarter. It means we get a quick pulse check of the team throughout the year. It’s also far less demanding than a daily or weekly mood check.
Beyond just having a mood check, the TeamRetro health check also provides statistical insight into the data. Beyond the pretty graphs, it acts as an enabler for encouraging discussion.
How we define team happiness and safety
Every organization will define team happiness differently. For us, these dimensions cover a range of team dimensions that impact on the culture or mood of the team. In summary these are:
- Ownership
How much ownership someone feels they have over their task or job.
- Value
Whether or not someone feels they are delivering value that can be measured.
- Goal Alignment
If their goals match those of the team and the wider company.
- Communication
If conflict is minimal and communication is easy, open and smooth.
- Team Roles
How well roles are defined and understood.
- Velocity
The efficient delivery of agreed outputs at the right quality.
- Support and resources
The level of support and resources available.
- Process
Whether or not processes support or hinder workflow.
- Fun
If there is engagement and fun.
We ran our team health check asynchronously over two weeks, allowing people to input their responses (happy, neutral or sad emoticons) at any time. They could also provide specific comments if they wanted to.
Keeping psychological safety in check
One of the key considerations was safety. There were a few ways we did this.
The first was to be open at meetings about the purpose of the surveys. We wanted the engagement to be high, but also honest. We made sure to let people know that they should indicate things that bother them and that it is okay. At the same time, we mentioned that we would not share comments but would follow up individually to address concerns.
We also ran the check semi-anonymously in order to build a sense of safety, giving people space to say how they feel with far less pressure. This meant that their score was anonymous, but that we could follow up on their comments to ensure they were not ignored.
Finally, the scores were discussed in aggregate and no one was pin-pointed. Unless they volunteered, there was no disclosure about individual responses, just that of the team.
Evaluating team mood data
We posted the survey on Slack, which we already integrated. Results were encouraged and reminded a few times and we had a 100% response rate.
Here’s what came out on the radar.

This radar shows the mean and range. While most of the scores were predominantly positive, the minimum range was still neutral in other dimensions, and negative in communications.

This can also be seen if we overlay individual scores, the thicker lines represented where there were more of the same responses. E.g. Goal alignment through to process.

The standard deviation showed that there was less deviation in process and ownership but that it was wider in communication and velocity. This suggests greater alignment in the responses around process through to team roles which gets wider as you go around the radar.

The mode shows the most common response. So in other words, the vast majority of the team had positive responses and maybe just a few individuals may have issues that required personal attention.

This is also reflected in the median (the middle score).
While presenting statistical data can stimulate a lot of questions, discussion and deliberations, it is just as important to look at the trends over time.
Looking at team mood and safety over time
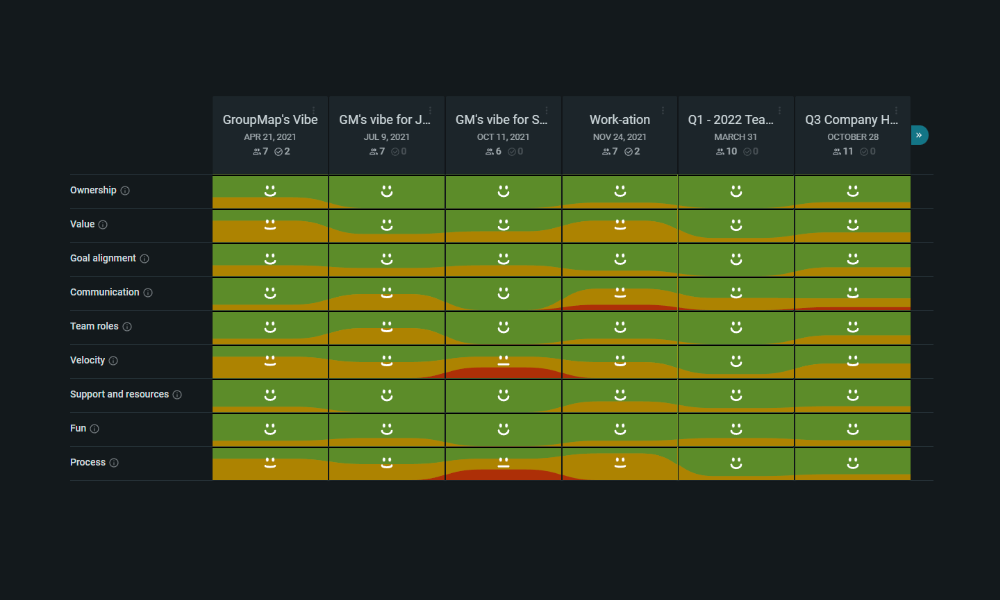
While a snapshot of a team’s health is valuable, so is looking at trends over time. Each column below represents a 6 monthly health check with the team.

In essence, our overall team’s mood was upbeat and strong, but it was clear that communication, value and velocity had room for improvement. Or at least it did in this cycle.
On a positive note, it was great to see that velocity and process issues previously addressed were sustaining, and that no one dimension had a high number of concerns. We previously dedicated a Goldilocks Retrospective to our process flow to streamline everything from customer service to internal provisioning requests.
Having said that, it was still important for us to look at the areas of communication, velocity and value. This ensures that they don’t slowly develop into issues later on down the track. Some insights did come through via comments, in addition to a good old fashioned chat.
The follow-up actions
Here’s what we did based on what we saw:
- We looked at specific comments and reached out to the individuals who shared their thoughts. We invited them to discuss and share solutions and to alleviate concerns. Some of this was very simple and easily fixed. Others just said they were having a bad day. Finally, others required further process changes.
- We shared the results with the team. Velocity, value and communication is not just down to management, or just the team but with everyone. Sharing the results openly and honestly was done to create visibility around the problem and having people think about what they can do to help improve the situation.
- We played some agile games . Specifically, these were the Agile Ball Point Game and Agile chocolate game. These games were designed to create a safe space where the team could experiment with ideas in a time-boxed way. Special thanks to Alexandrina Danifeld, for facilitating one of our sessions.
- We made changes to our kanban. For example, addressing value and velocity through a co-designed kanban workflow. By agreeing on process and deliverables, this helped to improve the smoothness and speed of output.

Final thoughts on team mood and safety checks
Our modus operandi aims to have a happy and productive workforce. One certainly feeds into another.
Running surveys and health checks can be confronting, especially when results are not perfect. However, without these data points generated from a culture of safety, there is little opportunity for improvement.
Would we do another health check in the future? Absolutely.
The only thing we would change is to ask people to suggest improvements, and why they feel a certain way. At a whole group level, we’d certainly like to understand what made people give positive feedback and responses. Knowing what elements make people happy means that we can repeat, replicate and reward going forward.
How do you gauge the health of your team’s mood and safety? What questions would you have asked, or what actions would you have taken?
We would love to hear your thoughts or questions. Reach out to us at info@teamretro.com